The biggest advantage of FPGAs is their flexibility, which inspires designers to create countless different designs. However, design debugging is usually only considered at the end - if it is still considered, the debugger usually has to adapt to the requirements of the system.
This article refers to the address: http://
The good news is that a company that has been working in the embedded world for nearly 30 years has introduced a debugger that has a wealth of experience in solving all the problems you can imagine, even those that you are not willing to hear. In this article, we'll show you some examples of the features of Lauterbach's TRACE32 debugger that will save you time and even save your project.
Flexible debugging for flexible platforms
When it comes to flexible design, we think of a very interesting system that our customers have introduced. The system integrates two Xilinx® MicroBlazeTM processor cores and one internal block RAM memory block on the VirtexTM-5 LX50T device. What makes this design special is that each MicroBlaze processor has only one I-side interface to the block RAM module for instruction fetching. Another storage port of the block RAM is connected to the PCI Express interface to remotely change application code and boot the processor at runtime. The challenge here is how to debug in a memory area that the debugger cannot read or write because the MicroBlaze processor itself cannot perform load/store operations in the memory area.
We use TRACE32's internal "virtual memory" to solve this problem. The emulator's internal emulation memory has an infinite address space (64 bits) that can be allocated as needed. We load the target program into this virtual memory and map the unreadable target memory to virtual memory by configuring the debugger's internal address translation mechanism. This makes it possible to perform program diagnostics at the assembly level.
But there is another challenge here: in order to implement step-by-step execution of programs, especially high-level language lines and conditional branches, people often use software breakpoints. Since it is not possible to access the block RAM through the MicroBlaze processor, this is obviously not possible. Our solution is to provide a "map.break" directive that forces the debugger to use hardware breakpoints within a given address range. Map instructions also allow you to specify the data width of the memory, change the size header characteristics, or completely disable the debugger from accessing certain address ranges with critical peripheral registers.
Small but useful features
Lauterbach's experience with JTAG debuggers and emulators is reflected in the capabilities of the TRACE32 debugger and many other minor and unexpected details. It's no surprise that Lauterbach is completely using its own tools to develop all the software. And everyday problems often motivate people to design the most useful features.
Have you ever needed to turn off the annoying timer interrupt handler during the debug phase, or change the conditional branch without rebooting? Have you ever needed a patch loop to see if the processor core is executing the instructions given by the external memory correctly? The assembler is enabling these functions.
Another common situation in debugging is: Is it often too far in a program to have to start again? The register recovery function can cancel the last operation.
TRACE32 displays the contents of the memory by uninterrupted memory rereading 10 times per second, and does not stop rereading even when the processor is stopped. Why is it doing this? It may happen that the MicroBlaze processor running uninterrupted in your system in one second causes data corruption, so you want to be able to monitor this. It is also possible that at some point unstable memory causes the screen to flicker. Or your JTAG interface is not as stable at 20MHz. These are all you would like to know. On the other hand, TRACE32 ensures that it only accesses memory when needed.
When it comes to peripherals, we should also mention peripheral register files. These files specify the location, width, and even bitwise encoding of the memory mapped registers and group them into a register tree. This makes it easy to access peripheral registers for inspection and modification: you can turn off the DMA controller with a single click without having to read the target manual carefully to find the correct bit. The debugger gives specifications for standard peripherals, but you can modify these files to meet your requirements with a simple text editor. For the Xilinx toolchain, plugin options can generate these files as part of the Xilinx build process.
Flexible IDE
TRACE32 provides a powerful graphical user interface (GUI) and its command line is very efficient: there is a debugger command line at the bottom of the screen, and almost all GUI functions are available through the command line—and thus through scripting. This makes it possible to automate all common tasks, including target configuration, window layout, and assigning them across multiple virtual screens. Best of all, unlike many IDEs, these windows don't have the docking feature, but you can also place and change the size of these windows, even overlapping. It can also be used with different IDEs, for example you can call TRACE32 directly from your Eclipse environment.
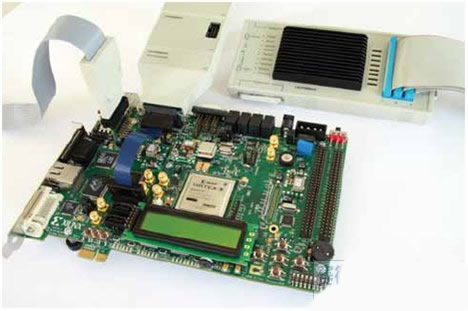
Figure 1 Lauterbach TRACE32 debug and trace cable connected to the Xilinx ML507 board
Connect multicore targets
Another interesting feature is Lauterbach's intuitive way to debug multicore targets. For example, provide a GUI for each core and have them share a debug cable. This is equally valid for heterogeneous systems that include PowerPC and MicroBlaze cores or other systems that use the 50-plus processor architecture supported by TRACE32 (Figure 1).
TRACE32 is connected to the same JTAG connector used by the Xilinx platform cable and is suitable for any design created by the Xilinx Embedded Development Kit (EDK). For PowerPC, a dedicated debug connector is also supported.
For multi-core systems, synchronous start and shutdown of the core is a problem. To support this in hardware, for example in a multi-microBlaze processor configuration, the debugger should use hardware features to achieve cycle-accurate synchronization, otherwise synchronization is done in software. The integrated scripting language understands the multicore case, allowing all GUI control to be done through a single main script, including connecting the debugger to the appropriate kernel and resetting it, as well as downloading and launching the application.
Real-time program flow and data tracking
The main function of real-time tracking is to record the program flow, that is, each instruction executed by the processor and the processing of the data. For the MicroBlaze processor, this is done through the Xilinx MicroBlaze Tracking Kernel (XMTC) in Xilinx Platform Studio. XMTC integrates a tracking encoder that includes an input interface to the MicroBlaze processor trace port (containing nearly 200 uncoded signals).
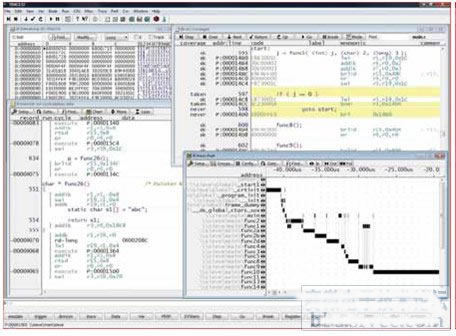
Figure 2 shows the Lauterbach TRACE32 IDE for windows such as traces, code coverage, and function call graphs.
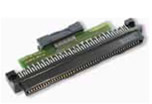
Figure 3A Lauterbach Mictor MicroBlaze Tracking Adapter for Xilinx Spartan-3E FPGA Board
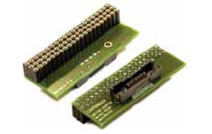
Figure 3B Lauterbach Mictor MicroBlaze Tracking Adapter for XilinxMLx Boards
It also includes an output interface that provides 21 signal encoding tracking.
The tracking hardware provides up to 512MB of external high-speed trace memory that can be used to replace rare on-chip storage resource storage trace information. The tracking function also supports the PowerPC architecture. In addition, there are more advanced features, including static function and task runtime analysis, variable access, code coverage analysis, etc. (Figure 2, Figures 3A and 3B).
Operating system support
On the MicroBlaze processor, TRACE32 provides a so-called kernel-sensitive module for μClinux and Linux. For PowerPC, more operating systems are supported, including QNX, VxWorks and Nucleus PLUS. These extensions allow the debugger to know the kernel-related data structures in the target. This makes it possible to implement process level debugging with process specified breakpoints and program control. Other features include support for full MMUs, real-time, non-intrusive display of Linux system resources such as loaded kernel modules or mounted file systems, statistical evaluation and graphical display of task runtimes, and task-related evaluation of function runtimes.
to sum up
Lauterbach TRACE32 provides a complete debug solution for all PowerPC and MicroBlaze processors on the Xilinx device family. Future Xilinx-related enhancements will further enhance the debug cable, allowing the XilinxChipScopeTM analyzer to use the debug cable to communicate with the debugger for target access and download the FPGA configuration bitstream through the debugger.
Rotary Switch
Main Band Switch characteristics as below:
- Providing different rotation angles degree for options.
- Including multiple output digital coding modes.
- Including inhibit and parity signal to avoid error.
- Water and oil resistance. (IP65)
- Gold plating double contact points, stable contact resistance, long service life.
- Easy installation
Band Switch,Rotary Type Band Switch,Cnc Panel Band Switch,Rotary Band Switch
Feyvan Electronics Technology Co., Ltd. , http://www.fv-cable-assembly.com